
Картографска пројекција — разлика између измена
м Враћене измене корисника 109.121.63.182 (разговор) на последњу измену корисника MareBG ознака: враћање |
. |
||
| Ред 1: | Ред 1: | ||
{{short description|Систематски приказ површине сфере или елипсоида на раван}} |
|||
'''Картографска пројекција''' је математички начин приказивања [[Земља|Земљине]] површине, тј. њеног [[Елипса#елипсоид|елипсоида]] на раван. Пренос се врши на основу зависности између [[координата|координатних тачака]] на обема површинама – у виду пројекције. Будући да је Земљину површину немогуће пренети на равну површину без одређених раскидања, набирања и неправилности, неизбежне су одређене [[деформације]] [[геометрија|геометријских]] својстава фигуре на раван. |
|||
[[Датотека:Claudius Ptolemy- The World.jpg|thumb|250px|A medieval depiction of the [[Ecumene]] (1482, Johannes Schnitzer, engraver), constructed after the coordinates in Ptolemy's [[Geography (Ptolemy)|''Geography'']] and using his second map projection]] |
|||
{{рут}} |
|||
'''Картографска пројекција''' је математички начин приказивања [[Земља|Земљине]] површине, тј. њеног [[Елипса#елипсоид|елипсоида]] на раван.<ref>{{cite book |last1=Lambert |first1=Johann |last2=Tobler |first2=Waldo |title=Notes and comments on the composition of terrestrial and celestial maps |date=2011 |publisher=ESRI Press |location=Redlands, CA |isbn=978-1-58948-281-4}}</ref><ref>{{cite book |last1=Richardus |first1=Peter |last2=Adler |first2=Ron |title=map projections |date=1972 |publisher=American Elsevier Publishing Company, inc. |location=New York, NY |isbn=0-444-10362-7}}</ref><ref>{{cite book |last1=Robinson |first1=Arthur |last2=Randall |first2=Sale |last3=Morrison |first3=Joel |last4=Muehrcke |first4=Phillip |title=Elements of Cartography |date=1985 |isbn=0-471-09877-9 |edition=fifth}}</ref> Пренос се врши на основу зависности између [[координата|координатних тачака]] на обема површинама – у виду пројекције. Будући да је Земљину површину немогуће пренети на равну површину без одређених раскидања, набирања и неправилности, неизбежне су одређене [[деформације]] [[геометрија|геометријских]] својстава фигуре на раван. In a map projection, [[coordinates]], often expressed as [[latitude]] and [[longitude]], of locations from the surface of the globe are transformed to coordinates on a plane.<ref name='Snyder1453'>{{cite book |
|||
|author1 = Snyder, J.P. |
|||
|author2 = Voxland, P.M. |
|||
|title = Album of Map Projections |
|||
|chapter = An album of map projections |
|||
|publisher = United States Government Printing Office |
|||
|date = 1989 |
|||
|url = https://pubs.usgs.gov/pp/1453/report.pdf |
|||
|series = U.S. Geological Survey Professional Paper |
|||
|volume = 1453 |
|||
|access-date = 8 March 2022 |
|||
|doi = 10.3133/pp1453 |
|||
}}</ref><ref name="EGmap">{{Cite journal|last=Ghaderpour|first=E.|date=2016|title=Some equal-area, conformal and conventional map projections: a tutorial review|journal=Journal of Applied Geodesy|volume=10|issue=3|pages=197–209|doi=10.1515/jag-2015-0033|arxiv=1412.7690|bibcode=2016JAGeo..10..197G|s2cid=124618009}}</ref> |
|||
Projection is a necessary step in creating a two-dimensional map and is one of the essential elements of cartography. |
|||
All projections of a sphere on a plane necessarily distort the surface in some way and to some extent.<ref>{{cite book |last1=Monmonier |first1=Mark |title=How to lie with maps |date=2018 |publisher=The University of Chicago Press |isbn=978-0-226-43592-3 |edition=3rd}}</ref> Depending on the purpose of the map, some distortions are acceptable and others are not; therefore, different map projections exist in order to preserve some properties of the sphere-like body at the expense of other properties. The study of map projections is primarily about the characterization of their distortions. There is no limit to the number of possible map projections.<ref name="SnyderFlattening"> |
|||
{{cite book |
|||
| author = Snyder, John P. |
|||
| title = Flattening the earth: two thousand years of map projections |
|||
| publisher = [[University of Chicago Press]] |
|||
| year = 1993 |
|||
| isbn = 0-226-76746-9 |
|||
}} |
|||
</ref>{{rp|1}} |
|||
Most of this article assumes that the surface to be mapped is that of a sphere. The [[Earth]] and other large [[celestial bodies]] are generally better modeled as [[oblate spheroid]]s, whereas small objects such as [[asteroid]]s often have irregular shapes. The surfaces of planetary bodies can be mapped even if they are too irregular to be modeled well with a sphere or ellipsoid.<ref>{{Citation|last1=Hargitai|first1=Henrik|title=Map Projections in Planetary Cartography|date=2017|work=Lecture Notes in Geoinformation and Cartography|pages=177–202|publisher=Springer International Publishing|isbn=978-3-319-51834-3|last2=Wang|first2=Jue|last3=Stooke|first3=Philip J.|last4=Karachevtseva|first4=Irina|last5=Kereszturi|first5=Akos|last6=Gede|first6=Mátyás|doi=10.1007/978-3-319-51835-0_7}}</ref> Therefore, more generally, a map projection is any method of flattening a continuous curved surface onto a plane. |
|||
The most well-known map projection is the [[Mercator projection]].<ref name="SnyderFlattening"/>{{rp|45}} This map projection has the property of being conformal. However, it has been criticized throughout the 20th century for enlarging regions further from the equator.<ref name="SnyderFlattening"/>{{rp|156{{ndash}}157}} To contrast, [[equal-area projection]]s such as the [[Sinusoidal projection]] and the [[Gall–Peters projection]] show the correct sizes of countries relative to each other, but distort angles. The [[National Geographic Society]] and most atlases favor map projections that compromise between area and angular distortion, such as the [[Robinson projection]] and the [[Winkel tripel projection]].<ref name="SnyderFlattening" /><ref>{{cite news |title=Which is the best map projection? |url=https://geoawesomeness.com/best-map-projection/ |work=Geoawesomeness |date=25 April 2017 |first=Ishveena |last=Singh}}</ref> |
|||
== Метричке особине карата == |
|||
[[Датотека:USGS map Albers conic tall.gif|thumb|250px|An [[Albers projection]] shows areas accurately, but distorts shapes.]] |
|||
Many properties can be measured on the Earth's surface independently of its geography: |
|||
* [[Area]] |
|||
* [[Shape]] |
|||
* [[Direction (geometry)|Direction]] |
|||
* [[Bearing (navigation)|Bearing]] |
|||
* [[Distance]] |
|||
===Other distortion metrics=== |
|||
Many other ways have been described of showing the distortion in projections.<ref>{{cite journal |last1=Mulcahy |first1=Karen A. |last2=Clarke |first2=Keith C. |title=Symbolization of Map Projection Distortion: A Review |journal=Cartography and Geographic Information Science |date=January 2001 |volume=28 |issue=3 |pages=167–182 |doi=10.1559/152304001782153044 |publisher=Cartography and Geographic Information Society |s2cid=26611469 |url=http://www.geog.ucsb.edu/~kclarke/Geography232/MulcahyClarke2001.pdf}}</ref><ref>{{cite book |last1=Canters |first1=Frank |title=Small-scale map projection design |date=2002 |publisher=Taylor & Francis |location=London |isbn=9780203472095 |page=[https://books.google.es/books?id=8cR7yG5ohHoC&pg=PA291 291] |series=Research monographs in geographic information systems}}</ref> Like Tissot's indicatrix, the '''Goldberg-Gott indicatrix''' is based on infinitesimals, and depicts ''flexion'' and ''skewness'' (bending and lopsidedness) distortions.<ref name="Goldberg-Gott">{{cite journal |
|||
| url = http://www.physics.drexel.edu/~goldberg/projections/goldberg_gott.pdf |
|||
| title = Flexion and Skewness in Map Projections of the Earth |
|||
| year = 2007 |
|||
| first1 = David M. |
|||
| last1 = Goldberg |
|||
| first2 = J. Richard |
|||
| last2 = Gott III |
|||
| journal = Cartographica |
|||
| volume = 42 |
|||
| issue = 4 |
|||
| pages = 297–318 |
|||
| access-date = 2011-11-14 |
|||
| doi=10.3138/carto.42.4.297 |
|||
| arxiv= astro-ph/0608501 |
|||
| s2cid = 11359702 |
|||
}}</ref> |
|||
Rather than the original (enlarged) infinitesimal circle as in Tissot's indicatrix, some visual methods project finite shapes that span a part of the map. |
|||
For example, a [[small circle]] of fixed radius (e.g., 15 degrees [[angular radius]]).<ref name="tiss">{{cite conference |url=http://www.geolab.polimi.it/wp-content/uploads/GW12_FOSS4G-eu15.pdf |title=Real-time projection visualisation with Indicatrix Mapper QGIS Plugin |author1-first=Ervin |author1-last=Wirth |author2-first=Péter |author2-last=Kun |date=July 2015 |conference=FOSS4G Europe 2015 |editor1-first=Maria Antonia |editor1-last=Brovelli |editor2-first=Marco |editor2-last=Minghini |editor3-first=Marco |editor3-last=Negreti |series=Geomatics Workbooks |volume=12 |book-title=Open Innovation for Europe |publisher=Polytechnic University of Milan |archive-url=https://web.archive.org/web/20220723153559/http://www.geolab.polimi.it/wp-content/uploads/GW12_FOSS4G-eu15.pdf |archive-date=23 July 2022 |url-status=live |location=Como, Italy |pages=697–700 |issn=1591-092X}}</ref> Sometimes [[spherical triangle]]s are used. |
|||
In the first half of the 20th century, projecting a human head onto different projections was common to show how distortion varies across one projection as compared to another.<ref name="rutgers">{{cite news |
|||
| title = This is your brain on maps |
|||
| date = 18 September 2013 |
|||
| url = http://bigthink.com/strange-maps/624-this-is-your-brain-on-maps |
|||
| first = Frank |
|||
| last = Jacobs |
|||
| department = Strange Maps |
|||
| work = Big Think |
|||
}}</ref> |
|||
In dynamic media, shapes of familiar coastlines and boundaries can be dragged across an interactive map to show how the projection distorts sizes and shapes according to position on the map.<ref>{{cite web |url=https://bramus.github.io/mercator-puzzle-redux/ |title=Mercator Puzzle Redux |access-date=24 January 2018 |first=Bramus |last=Van Damme}}</ref> |
|||
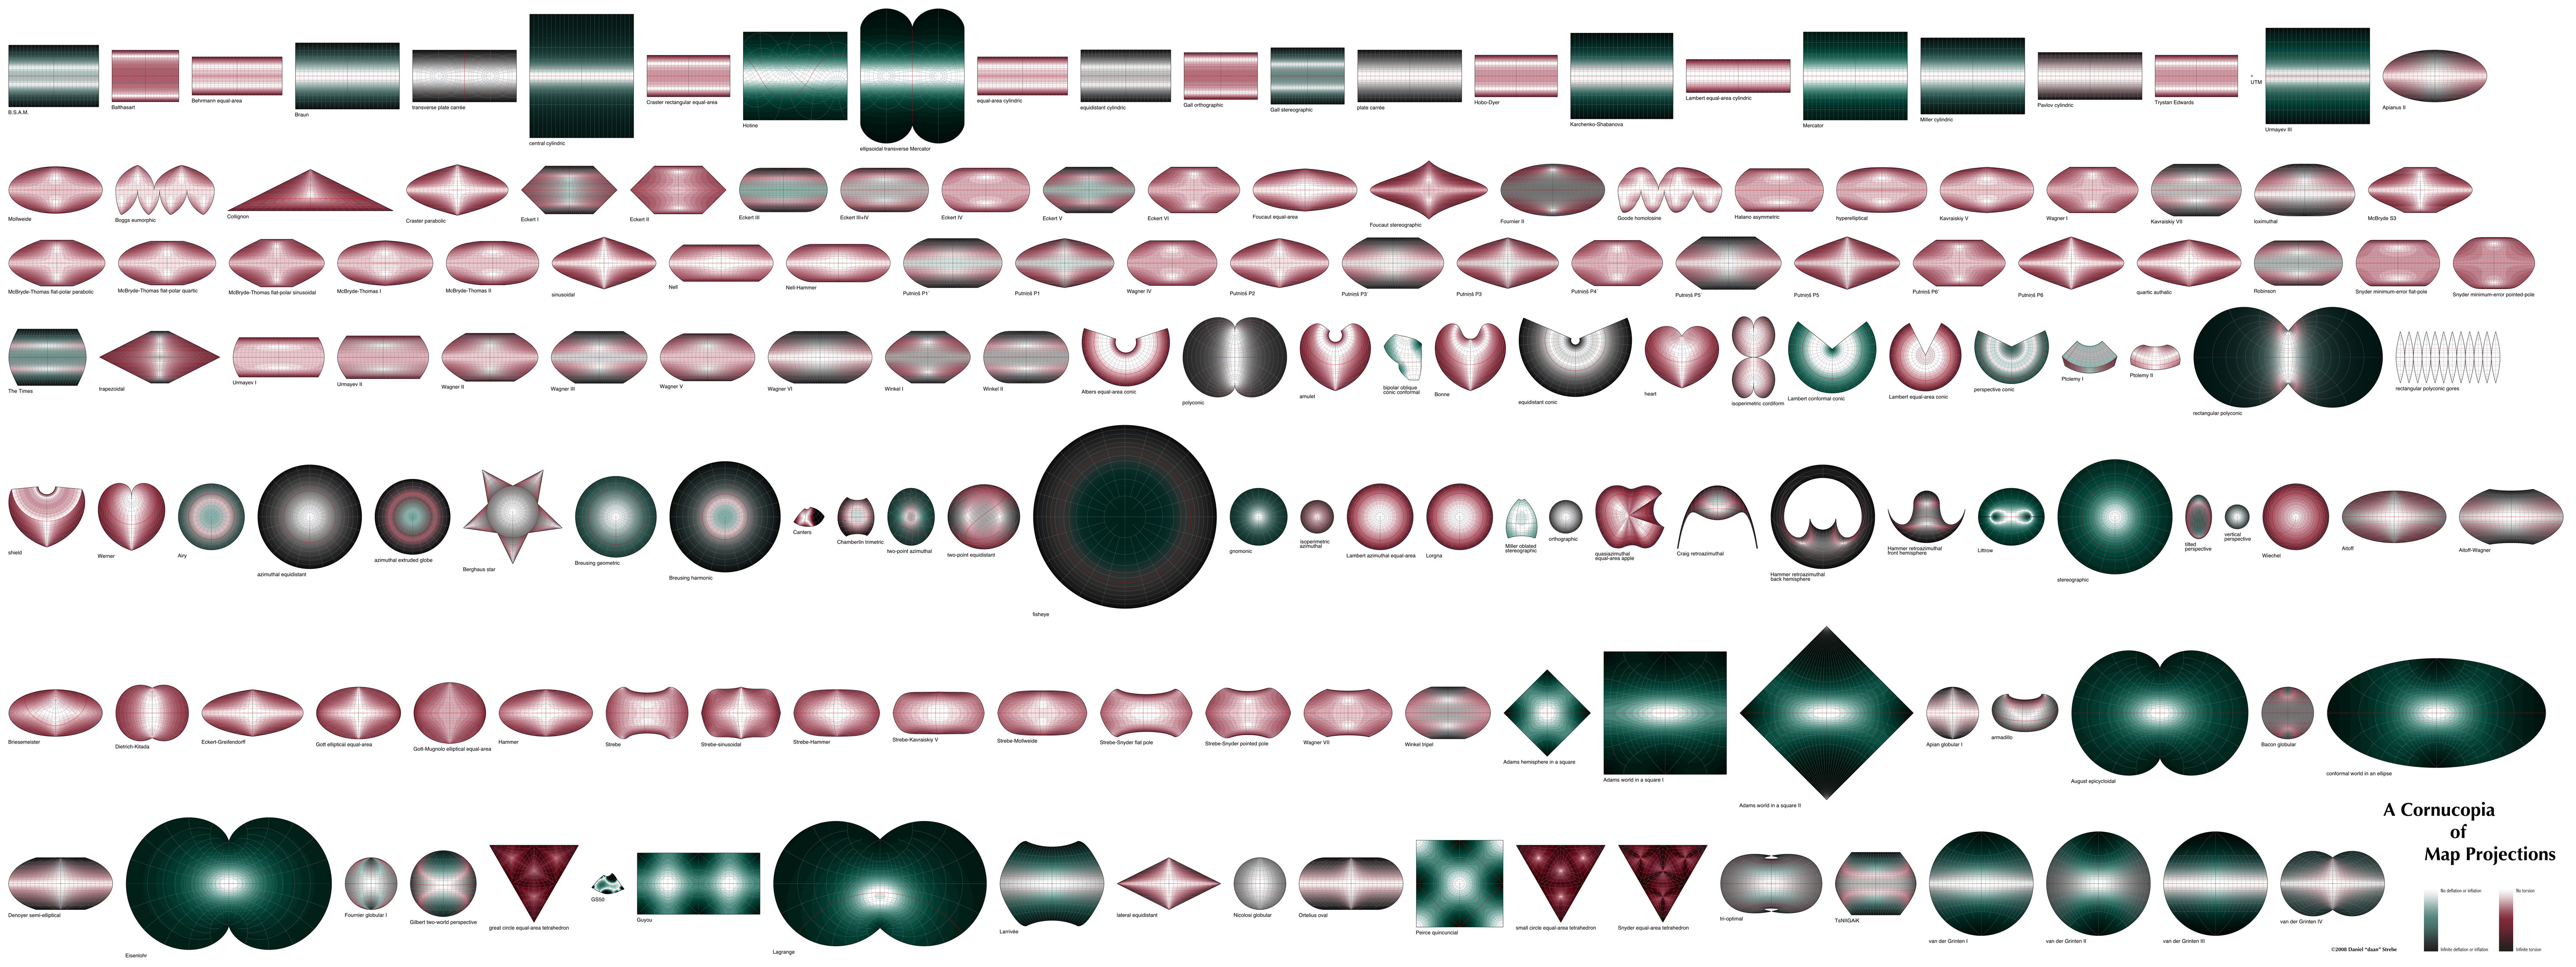
Another way to visualize local distortion is through grayscale or color gradations whose shade represents the magnitude of the angular deformation or areal inflation. Sometimes both are shown simultaneously by blending two colors to create a [[bivariate map]].<ref name="cornucopia">{{cite web |
|||
| title = A cornucopia of map projections |
|||
| url = http://www.mapthematics.com/Downloads/Images/Cornucopia33.jpg |
|||
| website = Mapthematics |
|||
}}</ref> |
|||
To measure distortion globally across areas instead of at just a single point necessarily involves choosing priorities to reach a compromise. Some schemes use distance distortion as a proxy for the combination of angular deformation and areal inflation; such methods arbitrarily choose what paths to measure and how to weight them in order to yield a single result. Many have been described.<ref name="Goldberg-Gott" /><ref name="AB Peters"> |
|||
{{cite journal |
|||
| last1 = Peters |
|||
| first1 = A. B. |
|||
| title = Uber Weltkartenverzerrunngen und Weltkartenmittelpunkte |
|||
| journal = {{ill|Kartographische Nachrichten|de}} |
|||
| pages = 106–113 |
|||
| year = 1978 |
|||
}}</ref><ref name = "GMC"> |
|||
{{cite arXiv |
|||
| last1 = Gott, III |
|||
| first1 = J. Richard |
|||
| last2 = Mugnolo |
|||
| first2 = Charles |
|||
| last3 = Colley |
|||
| first3 = Wesley N. |
|||
| title = Map projections for minimizing distance errors |
|||
| eprint = astro-ph/0608500v1 |
|||
| year = 2006 |
|||
}}</ref><ref name = "Laskowski"> |
|||
{{cite journal |
|||
| last1 = Laskowski |
|||
| first1 = P. |
|||
| title = Distortion-spectrum fundamentals: A new tool for analyzing and visualizing map distortions |
|||
| journal = Cartographica |
|||
| volume = 34 |
|||
| issue = 3 |
|||
| year = 1997 |
|||
| doi = 10.3138/Y51X-1590-PV21-136G |
|||
| doi-access = free |
|||
}}</ref><ref name = "Airy"> |
|||
{{cite journal |
|||
| last1 = Airy |
|||
| first1 = G.B. |
|||
| title = Explanation of a projection by balance of errors for maps applying to a very large extent of the Earth's surface; and comparison of this projection with other projections |
|||
| journal = London, Edinburgh, and Dublin Philosophical Magazine |
|||
| year = 1861 |
|||
| series = 4 |
|||
| volume = 22 |
|||
| issue = 149 |
|||
| pages = 409–421 |
|||
| doi = 10.1080/14786446108643179 |
|||
}}</ref> |
|||
== Елипсоид и геоид == |
== Елипсоид и геоид == |
||
| Ред 47: | Ред 170: | ||
* [[Картографија]] |
* [[Картографија]] |
||
*[[Географски координатни систем]] |
*[[Географски координатни систем]] |
||
== Референце == |
|||
{{reflist}} |
|||
== Литература == |
== Литература == |
||
{{refbegin|}} |
|||
* Мастило, Наталија (2005): ''Речник савремене српске географске терминологије'', Географски факултет, Београд |
* Мастило, Наталија (2005): ''Речник савремене српске географске терминологије'', Географски факултет, Београд |
||
* Љешевић, М, Живковић, Д. (2001): ''Картографија'', -{Magic Map}-, Смедеревска Паланка |
* Љешевић, М, Живковић, Д. (2001): ''Картографија'', -{Magic Map}-, Смедеревска Паланка |
||
* Fran Evanisko, American River College, lectures for Geography 20: "Cartographic Design for GIS", Fall 2002 |
|||
* [https://anderson.map-projections.net/ Map Projections]—PDF versions of numerous projections, created and released into the Public Domain by Paul B. Anderson ... member of the International Cartographic Association's Commission on Map Projections |
|||
{{refend}} |
|||
== Спољашње везе == |
|||
{{sisterlinks|d=Q186386|c=category:Map projections|n=no|b=no|v=no|voy=no|mw=no|s=no|m=no|species=no|q=no|wikt=no}} |
|||
* {{cite web |
|||
| url = http://pubs.usgs.gov/pp/1453/report.pdf |
|||
| title = An Album of Map Projections |
|||
}} {{small|(12.6 MB)}}, U.S. Geological Survey Professional Paper 1453, by John P. Snyder (USGS) and Philip M. Voxland (U. Minnesota), 1989. |
|||
* [http://www.mapthematics.com/Projections/Images/Cornucopia33.jpg A Cornucopia of Map Projections], a visualization of distortion on a vast array of map projections in a single image. |
|||
* [http://www.giss.nasa.gov/tools/gprojector/ G.Projector], free software can render many projections ([[NASA]] [[GISS]]). |
|||
* [http://www.mapthematics.com/ProjectionsList.php Color images of map projections and distortion] (Mapthematics.com). |
|||
* [http://kartoweb.itc.nl/geometrics/Map%20projections/body.htm Geometric aspects of mapping: map projection] (KartoWeb.itc.nl). |
|||
* [http://www.se16.info/js/mapproj.htm Java world map projections], Henry Bottomley (SE16.info). |
|||
* [http://mathworld.wolfram.com/topics/MapProjections.html Map Projections] (MathWorld). |
|||
* [http://www.mapref.org/ MapRef: The Internet Collection of MapProjections and Reference Systems in Europe] |
|||
* [http://trac.osgeo.org/proj/ PROJ.4 – Cartographic Projections Library]. |
|||
* [http://www.radicalcartography.net/?projectionref Projection Reference] Table of examples and properties of all common projections (RadicalCartography.net). |
|||
* {{cite web |
|||
| url = http://kartoweb.itc.nl/geometrics/Map%20projections/Understanding%20Map%20Projections.pdf |
|||
| title = Understanding Map Projections |
|||
}} {{small|(1.70 MB)}}, Melita Kennedy ([[Esri]]). |
|||
* [http://demonstrations.wolfram.com/WorldMapProjections/ World Map Projections], [[Stephen Wolfram]] based on work by Yu-Sung Chang ([[Wolfram Demonstrations Project]]). |
|||
* [http://map-projections.net/ Compare Map Projections] |
|||
* [https://www.thetruesize.com/ "the true size" page show size of countries without distortion from Mercator projection] |
|||
{{Authority control}} |
|||
{{Картографске пројекције}} |
{{Картографске пројекције}} |
||
{{Commonscat|Map projections}} |
{{Commonscat|Map projections}} |
||
== Извори == |
|||
{{reflist}} |
|||
[[Категорија:Картографија]] |
[[Категорија:Картографија]] |
||
Верзија на датум 6. фебруар 2023. у 11:03

Један корисник управо ради на овом чланку. Молимо остале кориснике да му допусте да заврши са радом. Ако имате коментаре и питања у вези са чланком, користите страницу за разговор.
Хвала на стрпљењу. Када радови буду завршени, овај шаблон ће бити уклоњен. Напомене
|
Картографска пројекција је математички начин приказивања Земљине површине, тј. њеног елипсоида на раван.[1][2][3] Пренос се врши на основу зависности између координатних тачака на обема површинама – у виду пројекције. Будући да је Земљину површину немогуће пренети на равну површину без одређених раскидања, набирања и неправилности, неизбежне су одређене деформације геометријских својстава фигуре на раван. In a map projection, coordinates, often expressed as latitude and longitude, of locations from the surface of the globe are transformed to coordinates on a plane.[4][5] Projection is a necessary step in creating a two-dimensional map and is one of the essential elements of cartography.
All projections of a sphere on a plane necessarily distort the surface in some way and to some extent.[6] Depending on the purpose of the map, some distortions are acceptable and others are not; therefore, different map projections exist in order to preserve some properties of the sphere-like body at the expense of other properties. The study of map projections is primarily about the characterization of their distortions. There is no limit to the number of possible map projections.[7]:1
Most of this article assumes that the surface to be mapped is that of a sphere. The Earth and other large celestial bodies are generally better modeled as oblate spheroids, whereas small objects such as asteroids often have irregular shapes. The surfaces of planetary bodies can be mapped even if they are too irregular to be modeled well with a sphere or ellipsoid.[8] Therefore, more generally, a map projection is any method of flattening a continuous curved surface onto a plane.
The most well-known map projection is the Mercator projection.[7]:45 This map projection has the property of being conformal. However, it has been criticized throughout the 20th century for enlarging regions further from the equator.[7]:156–157 To contrast, equal-area projections such as the Sinusoidal projection and the Gall–Peters projection show the correct sizes of countries relative to each other, but distort angles. The National Geographic Society and most atlases favor map projections that compromise between area and angular distortion, such as the Robinson projection and the Winkel tripel projection.[7][9]
Метричке особине карата

Many properties can be measured on the Earth's surface independently of its geography:
Other distortion metrics
Many other ways have been described of showing the distortion in projections.[10][11] Like Tissot's indicatrix, the Goldberg-Gott indicatrix is based on infinitesimals, and depicts flexion and skewness (bending and lopsidedness) distortions.[12]
Rather than the original (enlarged) infinitesimal circle as in Tissot's indicatrix, some visual methods project finite shapes that span a part of the map. For example, a small circle of fixed radius (e.g., 15 degrees angular radius).[13] Sometimes spherical triangles are used.
In the first half of the 20th century, projecting a human head onto different projections was common to show how distortion varies across one projection as compared to another.[14] In dynamic media, shapes of familiar coastlines and boundaries can be dragged across an interactive map to show how the projection distorts sizes and shapes according to position on the map.[15]
Another way to visualize local distortion is through grayscale or color gradations whose shade represents the magnitude of the angular deformation or areal inflation. Sometimes both are shown simultaneously by blending two colors to create a bivariate map.[16]
To measure distortion globally across areas instead of at just a single point necessarily involves choosing priorities to reach a compromise. Some schemes use distance distortion as a proxy for the combination of angular deformation and areal inflation; such methods arbitrarily choose what paths to measure and how to weight them in order to yield a single result. Many have been described.[12][17][18][19][20]
Елипсоид и геоид
То што Земља није савршена лопта већ је спљоштена у елипсоид много компликује прављење пројекција. Детаљи рељефа (неравнине које чине планине и океани) додатно искривљују површину планете и још више отежавају верно преношење простора на равну површину карте.
Први картографи нису много знали о стварном облику Земље па су карте цртали произвољно, ослањајући се на добро познате оријентационе тачке. Међутим, развојем картографије добио се све прецизнији математички опис облика Земље. Испоставило се да елипсоид није погодан за картографски опис земљине површине, јер елипсоиди, ма колико тачни били, одступају од стварног облика Земље. Стварни облик Земље је назван геоид. Површина геоида није правилна, већ прати гравитационе силе. Мерењима гравитационог поља путем сателита установљен стварни геоид планете.
Географски координатни систем и датум
У практичној картографији се и даље користе елипсоиди. Међутим, свака карта поред елипсоида који дефинише облик Земље, мора имати и дефинисан координатни систем, који зовемо геодезијски или картографски датум.[21]
Подела пројекција


Картографске пројекције могу се поделити на неколико начина:
- према карактеру дефромација
- Конформне (угловерне, равноугаоне)
- Еквивалентне
- Еквидистантне
- Произвољне (еквидистантна)
- према начину конструисања картографске мреже
- према неком посебно постављеном услову
- Псеудоцилиндричне
- Псеудоконусне
- Произвољне (конвенционалне)
- Поликонусне
- Пројекција међународне карте
- Изведене
- пројекције крупноразмерних карата
Датум и пројекција у Србији
Свака географска карта је за сваки део планете специфично географски оријентисана, да би била прецизна за навигацију. Неопходно је да географски параметри буду прецизирани за сваки поједини регион, како би се за сваку тачку на карти могла одредити тачна географска координата. То се изводи одабиром најпогодније стандардизоване пројекције.
За подручје Србије и у земљама у окружењу (као и на топографским картама бивше Југославије) у употреби је Гаус-Кригерова (енгл. Transverse Mercator) пројекција у Херманскогел датуму који користи елипсоид Бесел 1841. На картама са овом пројекцијом кординате су изражене у метрима што је практично за пренос на ГПС уређај или на друге карте.[22]
Види још
Референце
- ^ Lambert, Johann; Tobler, Waldo (2011). Notes and comments on the composition of terrestrial and celestial maps. Redlands, CA: ESRI Press. ISBN 978-1-58948-281-4.
- ^ Richardus, Peter; Adler, Ron (1972). map projections. New York, NY: American Elsevier Publishing Company, inc. ISBN 0-444-10362-7.
- ^ Robinson, Arthur; Randall, Sale; Morrison, Joel; Muehrcke, Phillip (1985). Elements of Cartography (fifth изд.). ISBN 0-471-09877-9.
- ^ Snyder, J.P.; Voxland, P.M. (1989). „An album of map projections”. Album of Map Projections (PDF). U.S. Geological Survey Professional Paper. 1453. United States Government Printing Office. doi:10.3133/pp1453. Приступљено 8. 3. 2022.
- ^ Ghaderpour, E. (2016). „Some equal-area, conformal and conventional map projections: a tutorial review”. Journal of Applied Geodesy. 10 (3): 197—209. Bibcode:2016JAGeo..10..197G. S2CID 124618009. arXiv:1412.7690
 . doi:10.1515/jag-2015-0033.
- ^ Monmonier, Mark (2018). How to lie with maps (3rd изд.). The University of Chicago Press. ISBN 978-0-226-43592-3.
- ^ а б в г Snyder, John P. (1993). Flattening the earth: two thousand years of map projections. University of Chicago Press. ISBN 0-226-76746-9.
- ^ Hargitai, Henrik; Wang, Jue; Stooke, Philip J.; Karachevtseva, Irina; Kereszturi, Akos; Gede, Mátyás (2017), „Map Projections in Planetary Cartography”, Lecture Notes in Geoinformation and Cartography, Springer International Publishing, стр. 177—202, ISBN 978-3-319-51834-3, doi:10.1007/978-3-319-51835-0_7
- ^ Singh, Ishveena (25. 4. 2017). „Which is the best map projection?”. Geoawesomeness.
- ^ Mulcahy, Karen A.; Clarke, Keith C. (јануар 2001). „Symbolization of Map Projection Distortion: A Review” (PDF). Cartography and Geographic Information Science. Cartography and Geographic Information Society. 28 (3): 167—182. S2CID 26611469. doi:10.1559/152304001782153044.
- ^ Canters, Frank (2002). Small-scale map projection design. Research monographs in geographic information systems. London: Taylor & Francis. стр. 291. ISBN 9780203472095.
- ^ а б Goldberg, David M.; Gott III, J. Richard (2007). „Flexion and Skewness in Map Projections of the Earth” (PDF). Cartographica. 42 (4): 297—318. S2CID 11359702. arXiv:astro-ph/0608501 . doi:10.3138/carto.42.4.297. Приступљено 2011-11-14.
- ^ Wirth, Ervin; Kun, Péter (јул 2015). „Real-time projection visualisation with Indicatrix Mapper QGIS Plugin” (PDF). Ур.: Brovelli, Maria Antonia; Minghini, Marco; Negreti, Marco. Open Innovation for Europe. FOSS4G Europe 2015. Geomatics Workbooks. 12. Como, Italy: Polytechnic University of Milan. стр. 697—700. ISSN 1591-092X. Архивирано (PDF) из оригинала 23. 7. 2022. г.
- ^ Jacobs, Frank (18. 9. 2013). „This is your brain on maps”. Strange Maps. Big Think.
- ^ Van Damme, Bramus. „Mercator Puzzle Redux”. Приступљено 24. 1. 2018.
- ^ „A cornucopia of map projections”. Mapthematics.
- ^ Peters, A. B. (1978). „Uber Weltkartenverzerrunngen und Weltkartenmittelpunkte”. de: 106—113.
- ^
Gott, III, J. Richard; Mugnolo, Charles; Colley, Wesley N. (2006). „Map projections for minimizing distance errors”. arXiv:astro-ph/0608500v1 .
- ^
Laskowski, P. (1997). „Distortion-spectrum fundamentals: A new tool for analyzing and visualizing map distortions”. Cartographica. 34 (3). doi:10.3138/Y51X-1590-PV21-136G .
- ^ Airy, G.B. (1861). „Explanation of a projection by balance of errors for maps applying to a very large extent of the Earth's surface; and comparison of this projection with other projections”. London, Edinburgh, and Dublin Philosophical Magazine. 4. 22 (149): 409—421. doi:10.1080/14786446108643179.
- ^ Peđa Supurović, beležnica: Šta je datum geografske (topografske) karte?
- ^ Peđa Supurović, beležnica: Datum i projekcija topografskih karata Srbije i Crne Gore
Литература
- Мастило, Наталија (2005): Речник савремене српске географске терминологије, Географски факултет, Београд
- Љешевић, М, Живковић, Д. (2001): Картографија, Magic Map, Смедеревска Паланка
- Fran Evanisko, American River College, lectures for Geography 20: "Cartographic Design for GIS", Fall 2002
- Map Projections—PDF versions of numerous projections, created and released into the Public Domain by Paul B. Anderson ... member of the International Cartographic Association's Commission on Map Projections
Спољашње везе
- „An Album of Map Projections” (PDF). (12.6 MB), U.S. Geological Survey Professional Paper 1453, by John P. Snyder (USGS) and Philip M. Voxland (U. Minnesota), 1989.
- A Cornucopia of Map Projections, a visualization of distortion on a vast array of map projections in a single image.
- G.Projector, free software can render many projections (NASA GISS).
- Color images of map projections and distortion (Mapthematics.com).
- Geometric aspects of mapping: map projection (KartoWeb.itc.nl).
- Java world map projections, Henry Bottomley (SE16.info).
- Map Projections (MathWorld).
- MapRef: The Internet Collection of MapProjections and Reference Systems in Europe
- PROJ.4 – Cartographic Projections Library.
- Projection Reference Table of examples and properties of all common projections (RadicalCartography.net).
- „Understanding Map Projections” (PDF). (1.70 MB), Melita Kennedy (Esri).
- World Map Projections, Stephen Wolfram based on work by Yu-Sung Chang (Wolfram Demonstrations Project).
- Compare Map Projections
- "the true size" page show size of countries without distortion from Mercator projection
| Државне | |
|---|---|
| Остале | |
| Према карактеру деформација | | |
|---|---|---|
| Према начину конструисања мреже | ||
| Према посебном услову | ||
| Пројекције крупноразмерних карата | ||