
Датотека:Aliasing between a positive and a negative frequency.png
Veća rezolucija nije dostupna.
Aliasing_between_a_positive_and_a_negative_frequency.png (694 × 452 piksela, veličina datoteke: 44 kB, MIME tip: image/png)
| Ovo je datoteka sa Vikimedijine ostave. Informacije sa njene stranice sa opisom prikazane su ispod. Vikimedijina ostava je skladište slobodno licenciralnih multimedijalnih datoteka. I Vi možete da pomognete. |
Opis izmene
| Opis |
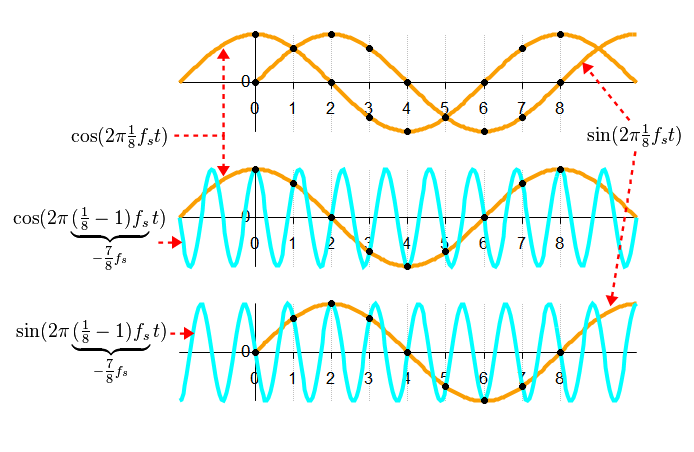
English: This figure depicts two complex sinusoids, colored gold and cyan, that fit the same sets of real and imaginary sample points. They are thus aliases of each other when sampled at the rate (fs) indicated by the grid lines. The gold-colored function depicts a positive frequency, because its real part (the cos function) leads its imaginary part by 1/4 of one cycle. The cyan function depicts a negative frequency, because its real part lags the imaginary part. |
|||
| Datum | ||||
| Izvor | Sopstveno delo | |||
| Autor | Bob K | |||
| Dozvola (Ponovno korišćenje ove datoteke) |
Ja, nosilac autorskog prava nad ovim delom, objavljujem isto pod sledećom licencom:
|
|||
| Ostale verzije |
Derivative works of this file: Aliasing between a positive and a negative frequency.svg
|
|||
| PNG genesis | This PNG graphic was created with LibreOffice. |
|||
| Octave/gnuplot source | click to expand
This graphic was created with the help of the following Octave script: graphics_toolkit gnuplot
gold = [251 159 3]/256; % arbitrary color choice
sam_per_sec = 1;
T = 1/sam_per_sec; % sample interval
dt = T/20; % time-resolution of continuous functions
cycle_per_sec = sam_per_sec/8; % sam_per_sec = 8 * cycle_per_sec (satisfies Nyquist)
figure
subplot(3,1,1)
xlim([-2 10])
ylim([-1.3 1.3])
% Plot cosine function
start_time_sec = -2;
stop_time_sec = 10;
x = start_time_sec : dt : stop_time_sec;
y = cos(2*pi*cycle_per_sec*x);
plot(x, y, "color", gold, "linewidth", 4)
box off % no border around plot please
hold on % same axes for next 3 plots
% Plot sine function
start_time_sec = 0;
stop_time_sec = 10;
x = start_time_sec : dt : stop_time_sec;
y = sin(2*pi*cycle_per_sec*x);
plot(x, y, "color", gold, "linewidth", 4)
% Sample cosine function at sample-rate (1/T)
start_time_sec = 0;
stop_time_sec = 8;
x = start_time_sec : T : stop_time_sec;
y = cos(2*pi*cycle_per_sec*x);
plot(x, y, "color", "black", ".")
% Sample sine function
y = sin(2*pi*cycle_per_sec*x);
plot(x, y, "color", "black", ".")
set(gca, "xaxislocation", "origin")
set(gca, "yaxislocation", "origin")
set(gca, "xgrid", "on");
set(gca, "ygrid", "off");
set(gca, "ytick", [0]);
set(gca, "xtick", [0:8]);
subplot(3,1,2)
xlim([-2 10])
ylim([-1.3 1.3])
cycle_per_sec2 = cycle_per_sec - sam_per_sec; % negative frequency
% Re-plot same cosine function on new axes
start_time_sec = -2;
stop_time_sec = 10;
x = start_time_sec : dt : stop_time_sec;
y = cos(2*pi*cycle_per_sec*x);
plot(x, y, "color", gold, "linewidth", 4)
box off
hold on
% Plot other cosine function
start_time_sec = -2;
stop_time_sec = 10;
x = start_time_sec : dt : stop_time_sec;
y = cos(2*pi*cycle_per_sec2*x);
plot(x, y, "color", "cyan", "linewidth", 4)
% Sample cosine functions at sample-rate (1/T)
start_time_sec = 0;
stop_time_sec = 8;
x = start_time_sec : T : stop_time_sec;
y = cos(2*pi*cycle_per_sec*x);
plot(x, y, "color", "black", ".")
set(gca, "xaxislocation", "origin")
set(gca, "yaxislocation", "origin")
set(gca, "xgrid", "on");
set(gca, "ygrid", "off");
set(gca, "ytick", [0]);
set(gca, "xtick", [0:8]);
subplot(3,1,3)
xlim([-2 10])
ylim([-1.3 1.3])
% Re-plot original sine function on new axes
start_time_sec = 0;
stop_time_sec = 10;
x = start_time_sec : dt : stop_time_sec;
y = sin(2*pi*cycle_per_sec*x);
plot(x, y, "color", gold, "linewidth", 4)
box off
hold on
% Plot other sine function
start_time_sec = -2;
stop_time_sec = 10;
x = start_time_sec : dt : stop_time_sec;
y = sin(2*pi*cycle_per_sec2*x);
plot(x, y, "color", "cyan", "linewidth", 4)
% Sample sine functions at sample-rate (1/T)
start_time_sec = 0;
stop_time_sec = 8;
x = start_time_sec : T : stop_time_sec;
y = sin(2*pi*cycle_per_sec*x);
plot(x, y, "color", "black", ".")
set(gca, "xaxislocation", "origin")
set(gca, "yaxislocation", "origin")
set(gca, "xgrid", "on");
set(gca, "ygrid", "off");
set(gca, "ytick", [0]);
set(gca, "xtick", [0:8]);
|


Istorija datoteke
Kliknite na datum/vreme da biste videli tadašnju verziju datoteke.
| Datum/vreme | Minijatura | Dimenzije | Korisnik | Komentar | |
|---|---|---|---|---|---|
| trenutna | 07:26, 27. mart 2013. | | 694 × 452 (44 kB) | Bob K | User created page with UploadWizard |
Upotreba datoteke
Sledeća stranica koristi ovu datoteku:
Globalna upotreba datoteke
Drugi vikiji koji koriste ovu datoteku:
- Upotreba na ms.wikipedia.org