
Датотека:High plains fresh groundwater usage 2000.svg

Оригинална датотека (SVG датотека, номинално 747 × 946 пиксела, величина: 1,48 MB)
| Ово је датотека са Викимедијине оставе. Информације са њене странице са описом приказане су испод. Викимедијина остава је складиште слободно лиценциралних мултимедијалних датотека. И Ви можете да помогнете. |
Опис измене
| Опис |
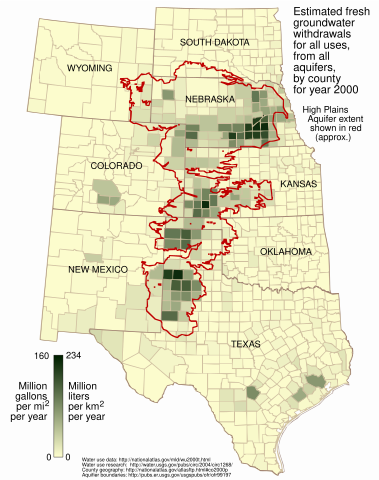
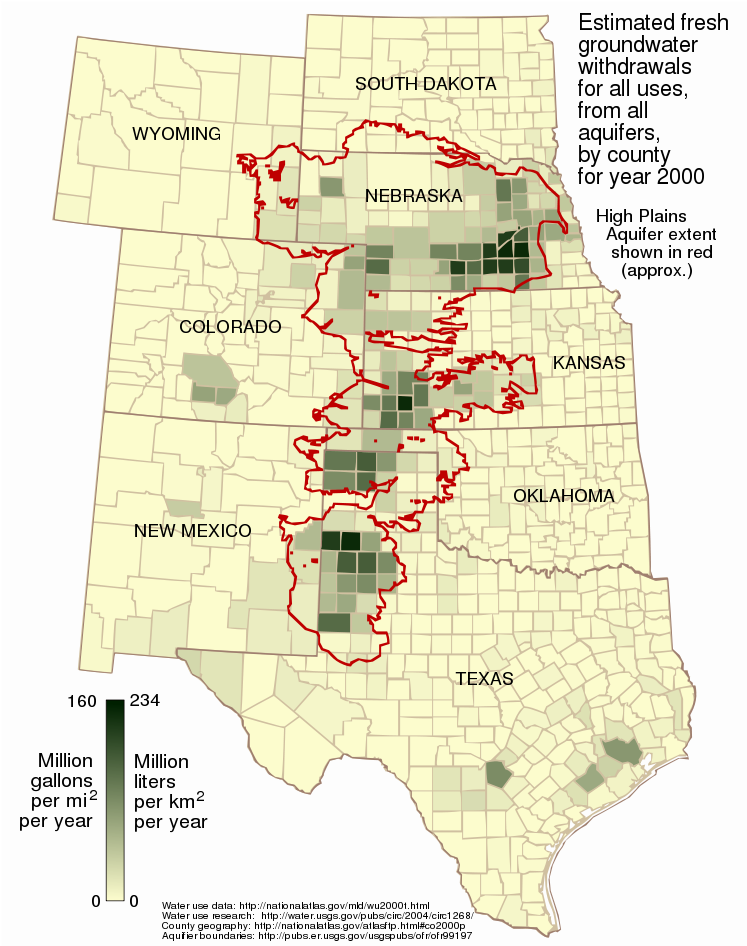
English: This map shows the estimated fresh water usage per square mile in the year 2000 for counties in the eight states underlain in part by the High Plains (Ogallala) Aquifer, presented as million gallons per square mile and million liters per square kilometer.
Usage is for all purposes -- public supply, industrial, irrigation, mining, livestock, and thermoelectric power -- from all underground sources, not just from the Ogallala Aquifer. Water usage data for the year 2000 was taken from the datafile wu2000t.dbf[1] from the US National Atlas[2]. Citation information from the metadata for that file:
Additionally:
The attribute used in this map is described:
The data is supplied as million gallons per day, by county. To arrive at an annual amount per square mile per year, the usage value from wu2000t.dbf was multiplied by 365 and divided by the number of square miles in the county as given in the 2000 county shapefile co2000p020 from the National Atlas:
Aquifer boundaries taken from Fischer and McGuire[3]. The map is presented in a Lambert azimuthal equal-area projection as used in the National Atlas (EPSG:2163[4]), the central meridian and latitude of which align nicely with the aquifer. |
| Датум | |
| Извор | Сопствено дело |
| Аутор | Kbh3rd |
| Остале верзије | File:Ogallala area freshwater ground withdrawals all aquifers.png |
Лиценцирање
- Дозвољено је:
- да делите – да умножавате, расподељујете и преносите дело
- да прерађујете – да прерадите дело
- Под следећим условима:
- ауторство – Морате да дате одговарајуће заслуге, обезбедите везу ка лиценци и назначите да ли су измене направљене. Можете то урадити на било који разуман манир, али не на начин који предлаже да лиценцатор одобрава вас или ваше коришћење.
- делити под истим условима – Ако измените, преобразите или доградите овај материјал, морате поделити своје доприносе под истом или компатибилном лиценцом као оригинал.
Историја датотеке
Кликните на датум/време да бисте видели тадашњу верзију датотеке.
| Датум/време | Минијатура | Димензије | Корисник | Коментар | |
|---|---|---|---|---|---|
| тренутна | 01:13, 10. март 2009. | | 747 × 946 (1,48 MB) | Kbh3rd | corrected metric conversion - see talk |
| 03:28, 3. март 2009. |  | 747 × 946 (1,48 MB) | Kbh3rd | The map said "acre" while the data, as noted on the image description page, correctly said "square mile". I have fixed that and made some minor esthetic adjustments of the state name locations. | |
| 01:40, 3. март 2009. |  | 747 × 946 (1,48 MB) | Kbh3rd | {{Information |Description={{en|1=This map shows the estimated fresh water usage per square mile in the year 2000 for counties in the eight states underlain in part by the High Plains (Ogallala) Aquifer, presented as million milli |
Употреба датотеке
Следећа страница користи ову датотеку:
Глобална употреба датотеке
Други викији који користе ову датотеку:
- Употреба на ar.wikipedia.org
- Употреба на ca.wikipedia.org
- Употреба на ckb.wikipedia.org
- Употреба на en.wikipedia.org
- Употреба на fy.wikipedia.org
- Употреба на kk.wikipedia.org
- Употреба на kw.wikipedia.org
- Употреба на ml.wikipedia.org
- Употреба на pt.wikipedia.org
- Употреба на vi.wikipedia.org
- Употреба на www.wikidata.org
- Употреба на zh.wikipedia.org