
Датотека:Number of prokaryotic genomes and sequencing costs.svg

Величина PNG прегледа за ову SVG датотеку је 800 × 533 пиксела. 6 других резолуција: 320 × 213 пиксела | 640 × 427 пиксела | 1.024 × 683 пиксела | 1.280 × 853 пиксела | 2.560 × 1.707 пиксела | 1.350 × 900 пиксела.
Оригинална датотека (SVG датотека, номинално 1.350 × 900 пиксела, величина: 145 kB)
| Ово је датотека са Викимедијине оставе. Информације са њене странице са описом приказане су испод. Викимедијина остава је складиште слободно лиценциралних мултимедијалних датотека. И Ви можете да помогнете. |
Опис измене
| Опис |
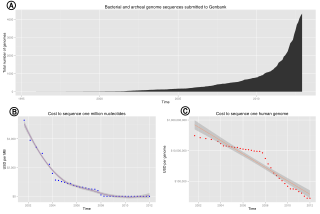
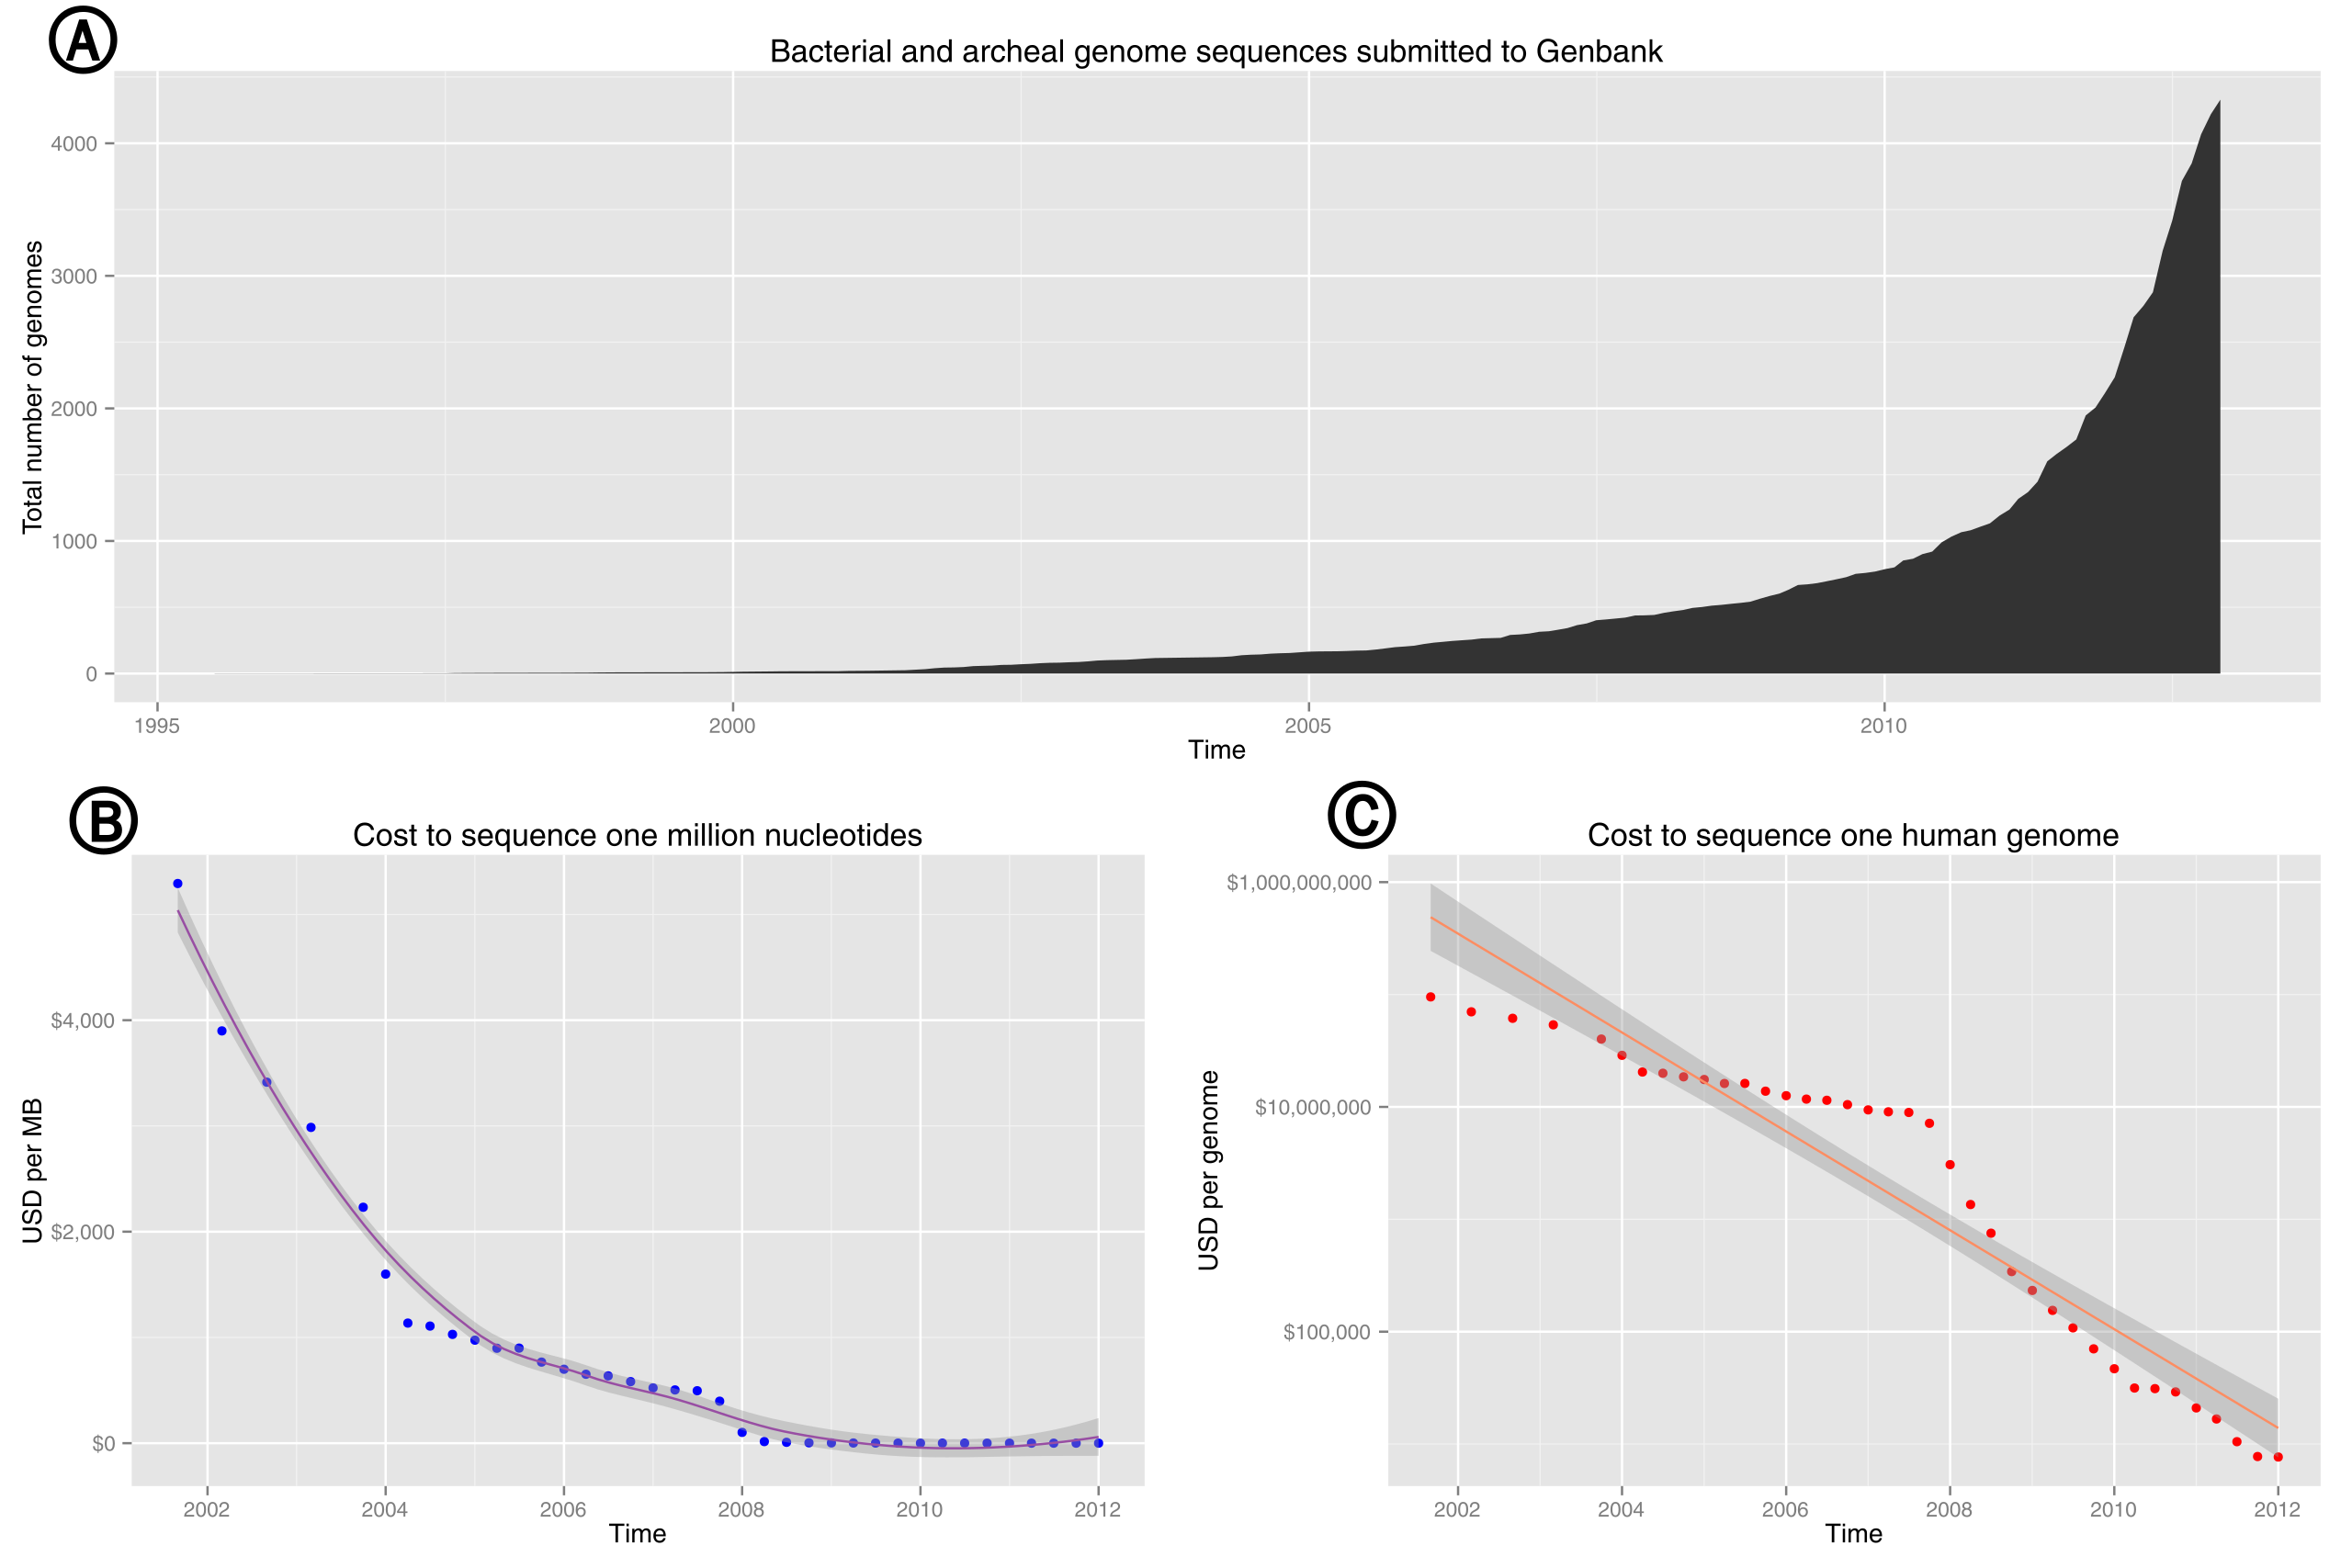
English: Plot of the total number of prokaryotic genomes submitted to Genbank as a function of time. Based on data from genome reports and genome.gov. Subfigures: (A) Exponential growth of genome sequence databases since 1995. (B) The cost in US Dollars (USD) to sequence one million bases. (C) The cost in USD to sequence a 3,000 Mb (human-sized) genome on a log10 transformed scale. |
| Датум | |
| Извор | Сопствено дело |
| Аутор | Estevezj |
| Остале верзије |
This file was derived from: Bacterial and archeal genome sequences submitted to Genbank.svg: |
| SVG genesis | |
| Изворни код | R code# Download our tables from NCBI's FTP site. Accessed 14:30PST, 18 December 2012
prok <- read.table("ftp://ftp.ncbi.nlm.nih.gov/genomes/GENOME_REPORTS/prokaryotes.txt", sep="\t", comment.char="!", header=T)
# Pull release dates, while dropping rows lacking a release date.
prok <- as.Date(prok$Release.Date[prok$Release.Date != '-'],format="%Y/%m/%d")
# Bin our dates by month and year, tabulate, and save to a dataframe.
prok.cut <- as.data.frame(
table(
as.Date(
cut(prok, "month")
)
)
)
# Correct our column titles, calculate a running total, and reconvert from factor to date
colnames(prok.cut) <- c("Date", "Total")
prok.cut$Total <- cumsum(prok.cut$Total)
prok.cut$Date <- as.Date(prok.cut$Date)
# DNA Sequencing Costs from NHGRI: http://www.genome.gov/sequencingcosts/
# Data from http://www.genome.gov/pages/der/sequencing_cost.pptx
# After munging the pptx, download the tables from pastebin. Accessed 12:42PST, 2012-12-20
seq.cost <- read.table("http://pastebin.com/raw.php?i=NA6c4i70", header=TRUE)
# Format the date.
seq.cost$Date <- as.Date(seq.cost$Date,format="%m-%d-%Y")
# Draw our plots
library("ggplot2")
library("grid")
library("scales")
(p <- ggplot(prok.cut, aes(Date, Total)) + geom_area() + ggtitle("Bacterial and archeal genome sequences submitted to Genbank") + xlab('Time') + ylab("Total number of genomes")
)
(mb <- ggplot(seq.cost, aes(Date, USD.per.Mb)) + geom_point(colour = "blue") +
stat_smooth(color="#984EA3")+
ggtitle("Cost to sequence one million nucleotides") +
xlab('Time') +
ylab("USD per MB") +
scale_y_continuous(labels = dollar)
)
(genome <- ggplot(seq.cost, aes(Date, USD.per.Genome)) + geom_point(colour = "red") +
stat_smooth(method='lm',color="#FC8D62")+
ggtitle("Cost to sequence one human genome") +
xlab('Time') +
ylab("USD per genome") +
scale_y_log10(labels = dollar)
)
# This part is based on Hadley's Ggplot2 book (doi:10.1007/978-0-387-98141-3_8)
# Save our plot to SVG
library(grDevices)
svg(filename='ncbi-genomes.svg', width = 15, height = 10)
grid.newpage()
pushViewport(viewport(layout = grid.layout(2, 2)))
vplayout <- function(x, y)
viewport(layout.pos.row = x, layout.pos.col = y)
print(p, vp = vplayout(1, 1:2))
print(mb, vp = vplayout(2, 1))
print(genome, vp = vplayout(2, 2))
dev.off()
|
Лиценцирање
Ја, носилац ауторских права над овим делом, објављујем исто под следећим лиценцама:
Ова датотека је доступна под лиценцом Creative Commons Ауторство-Делити под истим условима 3.0 Unported.
- Дозвољено је:
- да делите – да умножавате, расподељујете и преносите дело
- да прерађујете – да прерадите дело
- Под следећим условима:
- ауторство – Морате да дате одговарајуће заслуге, обезбедите везу ка лиценци и назначите да ли су измене направљене. Можете то урадити на било који разуман манир, али не на начин који предлаже да лиценцатор одобрава вас или ваше коришћење.
- делити под истим условима – Ако измените, преобразите или доградите овај материјал, морате поделити своје доприносе под истом или компатибилном лиценцом као оригинал.

|
Дата је дозвола да се копира, дистрибуира и/или мења овај документ под условима ГНУ-ове лиценце за слободну документацију, верзије 1.2 или било које новије верзије коју објави Задужбина за слободни софтвер; без непроменљивих одељака и без текста на насловној и задњој страни. Текст лиценце можете прочитати овде. |
Изаберите лиценцу по жељи.
Историја датотеке
Кликните на датум/време да бисте видели тадашњу верзију датотеке.
| Датум/време | Минијатура | Димензије | Корисник | Коментар | |
|---|---|---|---|---|---|
| тренутна | 07:04, 21. децембар 2012. | | 1.350 × 900 (145 kB) | Estevezj | Added subplot labels. |
| 06:50, 21. децембар 2012. |  | 1.350 × 900 (107 kB) | Estevezj | {{Information |Description ={{en|1=Plot of the total number of prokaryotic genomes submitted to Genbank as a function of time. Based on data from [http://www.ncbi.nlm.nih.gov/genome genome reports] and [http://www.genome.gov/sequencingcosts/ genome.... |
Употреба датотеке
Следећа страница користи ову датотеку:
Глобална употреба датотеке
Други викији који користе ову датотеку:
- Употреба на bs.wikipedia.org
- Употреба на en.wikipedia.org
- Употреба на id.wikipedia.org
- Употреба на mk.wikipedia.org