
Датотека:Timeline of US overdose deaths involving heroin, by other opioid involvement.jpg

Величина овог приказа: 800 × 600 пиксела. 4 друге резолуције: 320 × 240 пиксела | 640 × 480 пиксела | 1.024 × 768 пиксела | 1.200 × 900 пиксела.
Оригинална датотека (1.200 × 900 пиксела, величина датотеке: 188 kB, MIME тип: image/jpeg)
| Ово је датотека са Викимедијине оставе. Информације са њене странице са описом приказане су испод. Викимедијина остава је складиште слободно лиценциралних мултимедијалних датотека. И Ви можете да помогнете. |

|
Постоји и векторска верзија ове слике (у SVG формату).
Требало би је користити уместо ове битмап слике ако је боља. File:Timeline of US overdose deaths involving heroin, by other opioid involvement.jpg → File:US timeline. Heroin deaths.svg
За више информација о векторској графици, прочитајте Прелазак Оставе на SVG. Постоје и информације о подршци за SVG слике у Медијавикију. |
 |
Опис измене
| Опис |
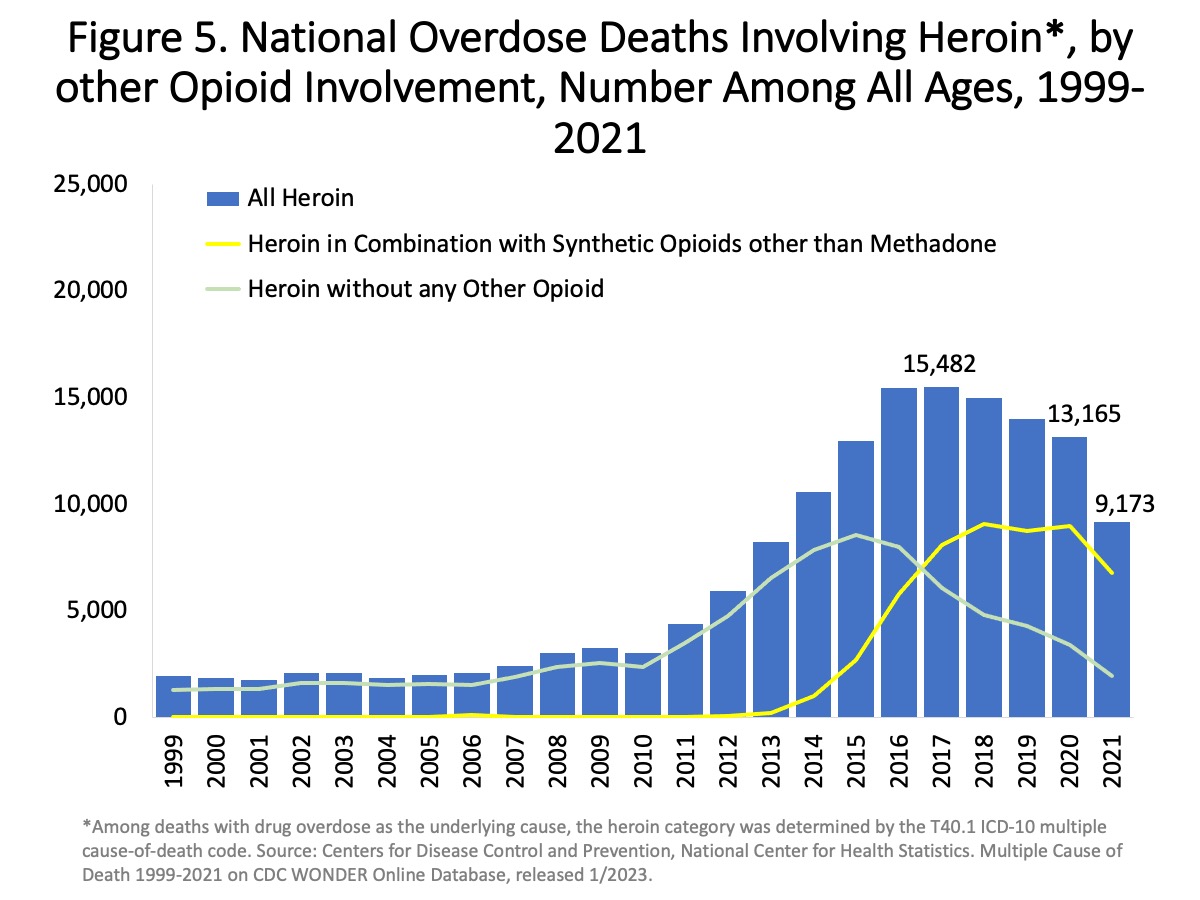
English: "Figure 5. National Overdose Deaths Involving Heroin, by Other Opioid Involvement—Number Among All Ages, 1999-2021. The figure above is a bar and line graph showing the total number of U.S. overdose deaths involving heroin from 1999 to 2021. Drug overdose deaths involving heroin rose from 1,960 in 1999 to 15,482 in 2017 before trending down to 13,165 deaths in 2020 and 9,173 deaths in 2021. The bars are overlaid by lines showing the number of deaths involving heroin in combination with synthetic opioids other than methadone (primarily fentanyl) or without any other opioid from 1999 to 2021 (Source: CDC WONDER)." |
| Датум | - date of first upload to the Commons. See file history for dates of later uploads. |
| Извор | Overdose Death Rates. By National Institute on Drug Abuse (NIDA). 1999-2021 chart. 1999-2019 chart. 2002-2017 chart. 2002-2015 chart. 2001-2014 chart. |
| Аутор | National Institute on Drug Abuse. Some versions of the chart were cropped, and have had "USA" added to them. Freeware IrfanView, etc. can be used. See Commons:Convert tables and charts to wiki code or image files, and the section about adding text to chart images. |
Лиценцирање
This image is a work of the National Institutes of Health, part of the United States Department of Health and Human Services, taken or made as part of an employee's official duties. As a work of the U.S. federal government, the image is in the public domain.
 |
||
| Утврђено је да ова датотека није ограничена у погледу ауторских права, укључујући и сва сродна и суседна права. | ||
Историја датотеке
Кликните на датум/време да бисте видели тадашњу верзију датотеке.
| Датум/време | Минијатура | Димензије | Корисник | Коментар | |
|---|---|---|---|---|---|
| тренутна | 02:00, 22. јул 2023. | | 1.200 × 900 (188 kB) | Timeshifter | Latest |
| 10:52, 31. август 2021. |  | 1.150 × 865 (184 kB) | Timeshifter | Latest chart from source. | |
| 17:23, 6. септембар 2018. |  | 810 × 589 (94 kB) | Timeshifter | newer chart | |
| 12:51, 27. март 2017. |  | 794 × 636 (91 kB) | Timeshifter | 2015 column. | |
| 13:11, 1. јануар 2016. |  | 791 × 586 (84 kB) | Timeshifter | User created page with UploadWizard |
Употреба датотеке
Следећа страница користи ову датотеку:
Глобална употреба датотеке
Други викији који користе ову датотеку:
- Употреба на ar.wikipedia.org
- Употреба на en.wikipedia.org
- Употреба на es.wikipedia.org
- Употреба на hy.wikipedia.org
- Употреба на ja.wikipedia.org
- Употреба на vi.wikipedia.org
- Употреба на zh.wikipedia.org