
Датотека:Estradiol during menstrual cycle.png

Оригинална датотека (3.682 × 1.640 пиксела, величина датотеке: 492 kB, MIME тип: image/png)
| Ово је датотека са Викимедијине оставе. Информације са њене странице са описом приказане су испод. Викимедијина остава је складиште слободно лиценциралних мултимедијалних датотека. И Ви можете да помогнете. |
Опис измене
| Опис |
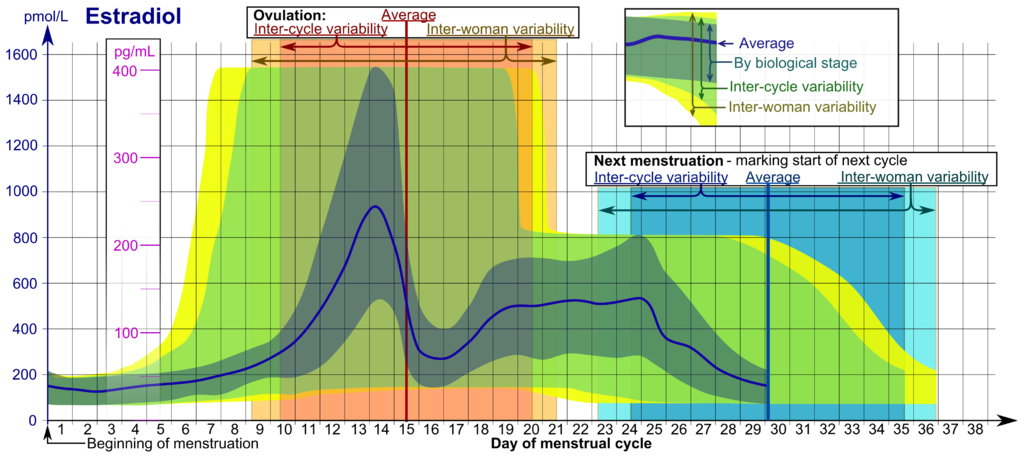
English: Reference ranges for the blood content of estradiol during the menstrual cycle.
InterpretationThe time scale starts with the beginning (or "onset") of (last) menstrual period (LMP), given as day number. Day number 1 corresponds to 0 to 0.99 days from LMP, and Day number 2 corresponds to 1.00 to 1.99 days from LMP and so forth. The time scale ends at whatever is the actual next menstruation, which marks the beginning of the next cycle, which is equivalent to starting all over again from the beginning of the time scale.
Hormone levels represent usual ones, not necessarily related to what is healthy. Hormone ranges vary between cases at the same biological stage of the menstrual cycle. Furthermore, the actual timing (usually given in day numbers from mentruation) of that biological stage varies, both between cycles of any single woman (inter-cycle) and between somen (inter-woman). Therefore, the appropriate ranges to use depend on how certain the actual biological stage can be estimated at any time.
DerivationSee source article:
|
||
| Датум | |||
| Извор |
Сопствено дело.
 |
||
| Аутор |
This image can be cited as:
|
||
| Остале верзије |
|

Лиценцирање
| Ја, творац овог дела, предајем га у јавно власништво. Ово се односи на цео свет. У неким земљама, ово није законски могуће; у том случају: Ја, творац овог дела дозвољавам свакоме да користи ово дело за било коју намену, без било каквих услова, осим услова које намеће закон. |
Историја датотеке
Кликните на датум/време да бисте видели тадашњу верзију датотеке.
| Датум/време | Минијатура | Димензије | Корисник | Коментар | |
|---|---|---|---|---|---|
| тренутна | 16:03, 22. јануар 2011. | | 3.682 × 1.640 (492 kB) | Mikael Häggström | Some fixes |
| 09:23, 22. јануар 2011. | 4.279 × 1.640 (524 kB) | Mikael Häggström | {{Information |Description={{en|1=Estradiol {{Description of menstrual cycle diagrams}}}} |Source={{own}} |Author=Mikael Häggström |Date=2011-01-22 |Permission= |other_versions= }} |
Употреба датотеке
Следећа страница користи ову датотеку:
Глобална употреба датотеке
Други викији који користе ову датотеку:
- Употреба на ar.wikipedia.org
- Употреба на as.wikipedia.org
- Употреба на bs.wikipedia.org
- Употреба на de.wikipedia.org
- Употреба на en.wikipedia.org
- Употреба на en.wikiversity.org
- Употреба на es.wikipedia.org
- Употреба на gl.wikipedia.org
- Употреба на he.wikipedia.org
- Употреба на hy.wikipedia.org
- Употреба на id.wikipedia.org
- Употреба на ml.wikipedia.org
- Употреба на pt.wikipedia.org
- Употреба на sl.wikipedia.org
- Употреба на sv.wikipedia.org
- Употреба на uk.wikipedia.org
- Употреба на www.wikidata.org
- Употреба на zh.wikipedia.org
- Употреба на zh.wikiversity.org