
Датотека:Economics Gini coefficient2.svg

Veličina PNG pregleda za ovu SVG datoteku je 500 × 500 piksela. 5 drugih rezolucija: 240 × 240 piksela | 480 × 480 piksela | 768 × 768 piksela | 1.024 × 1.024 piksela | 2.048 × 2.048 piksela.
Originalna datoteka (SVG datoteka, nominalno 500 × 500 piksela, veličina: 2 kB)
| Ovo je datoteka sa Vikimedijine ostave. Informacije sa njene stranice sa opisom prikazane su ispod. Vikimedijina ostava je skladište slobodno licenciralnih multimedijalnih datoteka. I Vi možete da pomognete. |
Opis izmene
| Opis |
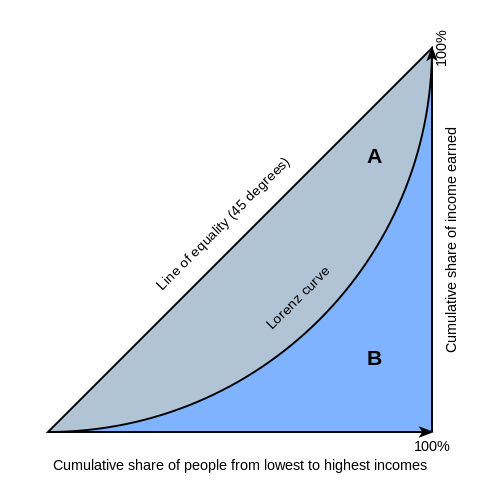
English: Gini coefficient diagram, based on the version by Bluemoose/BenFrantzDale. You can think of the horizontal axis as percent of people and the vertical axis as the percent of income those people receive. Therefore the Lorenz curves always start and end at the same places, where 0% of people make 0% of the country's income and 100% of people make 100% of the total income.
Inequality is implied when the curve is below the 45-degree line: At the left, the percentage of people is higher than the percent of income they receive (i.e. 10% of the people getting 5% of the total income); at the right, the percent of income received rises more than the percent of people receiving it. The area above the Lorenz curve -- marked "A" -- is shaded differently from the area below the curve -- marked "B". This simplifies the mathematical explanation of the gini coefficient, which is A/(A+B) |
| Datum | |
| Izvor | The original file was on WikiMedia Commons (http://en.wikipedia.org/wiki/File:Economics_Gini_coefficient.svg). I have edited the file. |
| Autor | Reidpath |
| Ostale verzije | Derivative works of this file: Economics Gini coefficient2-ar.svg |
Licenciranje
Наведени текст не подлеже заштити ауторских права и самим тим је у јавном власништву зато што није „литераран рад” у смислу локалног закона о ауторским правима. Факти, подаци и друге неоригиналне информације које су јавно добро и без довољног креативног уплива, углавном куцани текст, рукописи и прости геометријски облици нису предмет ауторског права.
Ова ознака у принципу није применљива на све слике текста. Одређене земље имају другачију законску дефиницију „литерарног рад”. Те земље штите готово сваки писани рад, док се у другима штите уметнички и научни текстови и базе података само. Количина креативног уплива, функција и дужина текста могу бити релевантни. Заштита ауторских права може бити ограничена на литерарну форму - информације у самој форми могу бити изузете од заштите ауторских права. |
Istorija datoteke
Kliknite na datum/vreme da biste videli tadašnju verziju datoteke.
| Datum/vreme | Minijatura | Dimenzije | Korisnik | Komentar | |
|---|---|---|---|---|---|
| trenutna | 20:00, 6. mart 2021. | | 500 × 500 (2 kB) | Nyq | decapitalized common nouns |
| 18:52, 20. mart 2016. |  | 500 × 500 (2 kB) | Wylve | Fixed CSS | |
| 18:51, 20. mart 2016. |  | 500 × 500 (2 kB) | Wylve | Reduce tracing artifacts | |
| 17:18, 24. jun 2009. |  | 500 × 500 (7 kB) | Reidpath | {{Information |Description={{en|1=Gini coefficient diagram, based on the version by Bluemoose/BenFrantzDale. You can think of the horizontal axis as percent of people and the vertical axis as the percent of income those people receive. Therefore the Loren |
Upotreba datoteke
Sledeća stranica koristi ovu datoteku:
Globalna upotreba datoteke
Drugi vikiji koji koriste ovu datoteku:
- Upotreba na af.wikipedia.org
- Upotreba na ar.wikipedia.org
- Upotreba na bh.wikipedia.org
- Upotreba na bn.wikipedia.org
- Upotreba na en.wikipedia.org
- Gini coefficient
- Lorenz curve
- Poverty
- Portal:Mathematics/Featured picture archive
- Wikipedia:Reference desk/Archives/Humanities/2010 December 18
- Portal:Mathematics/Featured picture/2012 08
- Wikipedia:Village pump (technical)/Archive 106
- Portal:Mathematics/Selected picture
- Portal:Mathematics/Selected picture/11
- User:Lexsta/sandbox
- Upotreba na et.wikipedia.org
- Upotreba na fa.wikipedia.org
- Upotreba na he.wikipedia.org
- Upotreba na it.wikipedia.org
- Upotreba na ja.wikipedia.org
- Upotreba na km.wikipedia.org
- Upotreba na la.wikipedia.org
- Upotreba na ms.wikipedia.org
- Upotreba na nl.wikipedia.org
- Upotreba na ro.wikipedia.org
- Upotreba na si.wikipedia.org
- Upotreba na sq.wikipedia.org
- Upotreba na te.wikipedia.org
- Upotreba na ur.wikipedia.org