
Датотека:GISS temperature 2000-09 lrg.png

Veličina ovog prikaza: 800 × 400 piksela. 5 drugih rezolucija: 320 × 160 piksela | 640 × 320 piksela | 1.024 × 512 piksela | 1.280 × 640 piksela | 2.880 × 1.440 piksela.
Originalna datoteka (2.880 × 1.440 piksela, veličina datoteke: 545 kB, MIME tip: image/png)
| Ovo je datoteka sa Vikimedijine ostave. Informacije sa njene stranice sa opisom prikazane su ispod. Vikimedijina ostava je skladište slobodno licenciralnih multimedijalnih datoteka. I Vi možete da pomognete. |
Opis izmene
| Opis |
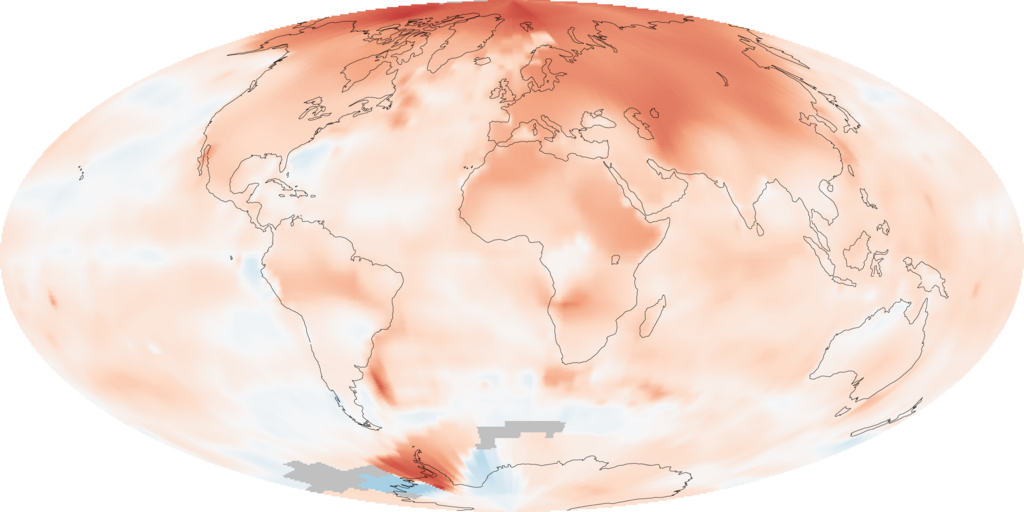
English: The map illustrates just how much warmer temperatures were in the decade (2000-2009) compared to average temperatures recorded between 1951 and 1980 (a common reference period for climate studies). The most extreme warming, shown in red, was in the Arctic. Very few areas saw cooler than average temperatures, shown in blue. Gray areas over parts of the Southern Ocean are places where temperatures were not recorded. The analysis, conducted by the Goddard Institute for Space Studies (GISS) in New York City, is based on temperatures recorded at meteorological (weather) stations around the world and satellite data over the oceans.
|
| Datum | |
| Izvor | NASA Earth Observatory Image of the Day: 2009 Ends Warmest Decade on Record http://earthobservatory.nasa.gov/IOTD/view.php?id=42392 |
| Autor | NASA images by Robert Simmon, based on data from the Goddard Institute for Space Studies. |
Licenciranje
| Ова датотека је у јавном власништву зато што је њен аутор НАСА. НАСА-а политика ауторских права наводи „Материјали НАСА-е нису заштићени ауторским правима осим ако није другачије наведено“. (Погледајте Template:PD-USGov, NASA copyright policy page или JPL Image Use Policy.) | ||
 |
Упозорења:
|
Istorija datoteke
Kliknite na datum/vreme da biste videli tadašnju verziju datoteke.
| Datum/vreme | Minijatura | Dimenzije | Korisnik | Komentar | |
|---|---|---|---|---|---|
| trenutna | 05:09, 23. januar 2010. | | 2.880 × 1.440 (545 kB) | Petersam | {{Information |Description={{en|1=The map illustrate just how much warmer temperatures were in the decade (2000-2009) compared to average temperatures recorded between 1951 and 1980 (a common reference period for climate studies). The most extreme warming |
Upotreba datoteke
Nema stranica koje koriste ovu datoteku.
Globalna upotreba datoteke
Drugi vikiji koji koriste ovu datoteku:
- Upotreba na ar.wikipedia.org
- Upotreba na as.wikipedia.org
- Upotreba na bn.wikipedia.org
- Upotreba na bxr.wikipedia.org
- Upotreba na cs.wikipedia.org
- Upotreba na en.wikipedia.org
- Upotreba na en.wikiversity.org
- Upotreba na es.wikipedia.org
- Upotreba na fa.wikipedia.org
- Upotreba na fr.wikipedia.org
- Upotreba na id.wikipedia.org
- Upotreba na ilo.wikipedia.org
- Upotreba na it.wikipedia.org
- Upotreba na ko.wikipedia.org
- Upotreba na or.wikipedia.org
- Upotreba na pnb.wikipedia.org
- Upotreba na pt.wikipedia.org
- Upotreba na pt.wikinews.org
- Upotreba na si.wikipedia.org
- Upotreba na sv.wikipedia.org
- Upotreba na uk.wikipedia.org
- Upotreba na vi.wikipedia.org
- Upotreba na www.wikidata.org
- Upotreba na zh.wikipedia.org