
Датотека:20240625 Global warming across generations - warming stripes.svg

Величина PNG прегледа за ову SVG датотеку је 660 × 600 пиксела. 6 других резолуција: 264 × 240 пиксела | 528 × 480 пиксела | 846 × 768 пиксела | 1.127 × 1.024 пиксела | 2.255 × 2.048 пиксела | 1.200 × 1.090 пиксела.
Оригинална датотека (SVG датотека, номинално 1.200 × 1.090 пиксела, величина: 20 kB)
| Ово је датотека са Викимедијине оставе. Информације са њене странице са описом приказане су испод. Викимедијина остава је складиште слободно лиценциралних мултимедијалних датотека. И Ви можете да помогнете. |
Опис измене
| Опис |
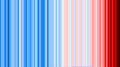
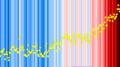
English: Diagram showing chart of global warming over time, juxtaposed with timeline showing lifetimes of various generations
|
||
| Датум | |||
| Извор | Сопствено дело | ||
| Аутор | RCraig09 |

Related files
-
 20190705 Warming stripes - Berkeley Earth (world) - avg above- and below-ice readings.png
PNG predecessor (early version, not using ColorBrewer hues) -
 1850- Warming stripes - global average surface temperature.svg
SVG successor -
 20190705 Warming stripes BEHIND line graph - Berkeley Earth (world).png
PNG predecessor (early version, not using ColorBrewer hues) -
 20240311 Warming stripes BEHIND line chart - global surface temperature.svg
SVG - warming stripes behind conventional line chart -
 20240625 Global warming across generations - warming stripes.svg
warming stripes juxtaposed with generations in history -
 Generation_timeline.svg
2020-, relevant to timing of different generations
_-_avg_above-_and_below-ice_readings.png)

.png)


Лиценцирање
Ја, носилац ауторског права над овим делом, објављујем исто под следећом лиценцом:
Ова датотека је доступна под лиценцом Creative Commons Ауторство-Делити под истим условима 4.0 међународна.
- Дозвољено је:
- да делите – да умножавате, расподељујете и преносите дело
- да прерађујете – да прерадите дело
- Под следећим условима:
- ауторство – Морате да дате одговарајуће заслуге, обезбедите везу ка лиценци и назначите да ли су измене направљене. Можете то урадити на било који разуман манир, али не на начин који предлаже да лиценцатор одобрава вас или ваше коришћење.
- делити под истим условима – Ако измените, преобразите или доградите овај материјал, морате поделити своје доприносе под истом или компатибилном лиценцом као оригинал.
Историја датотеке
Кликните на датум/време да бисте видели тадашњу верзију датотеке.
| Датум/време | Минијатура | Димензије | Корисник | Коментар | |
|---|---|---|---|---|---|
| тренутна | 07:05, 25. јун 2024. | | 1.200 × 1.090 (20 kB) | RCraig09 | Uploaded own work with UploadWizard |
Употреба датотеке
Следећа страница користи ову датотеку:
Глобална употреба датотеке
Други викији који користе ову датотеку:
- Употреба на en.wikipedia.org
- Politics of climate change
- Intergenerational equity
- Climate justice
- Intergenerationality
- Talk:Juliana v. United States
- Climate change litigation
- Our Children's Trust
- School Strike for Climate
- Right to a healthy environment
- Political views of Generation Z
- Talk:Political views of Generation Z
- Climate change ethics
- Held v. Montana